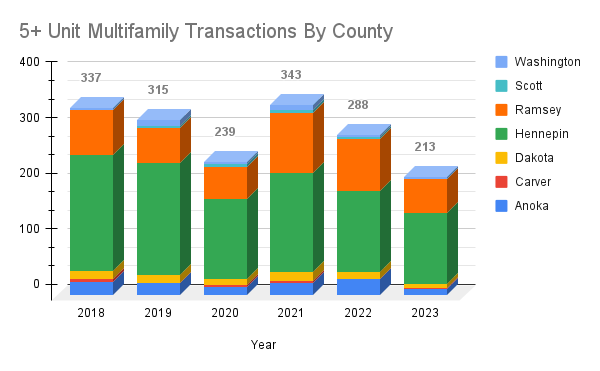
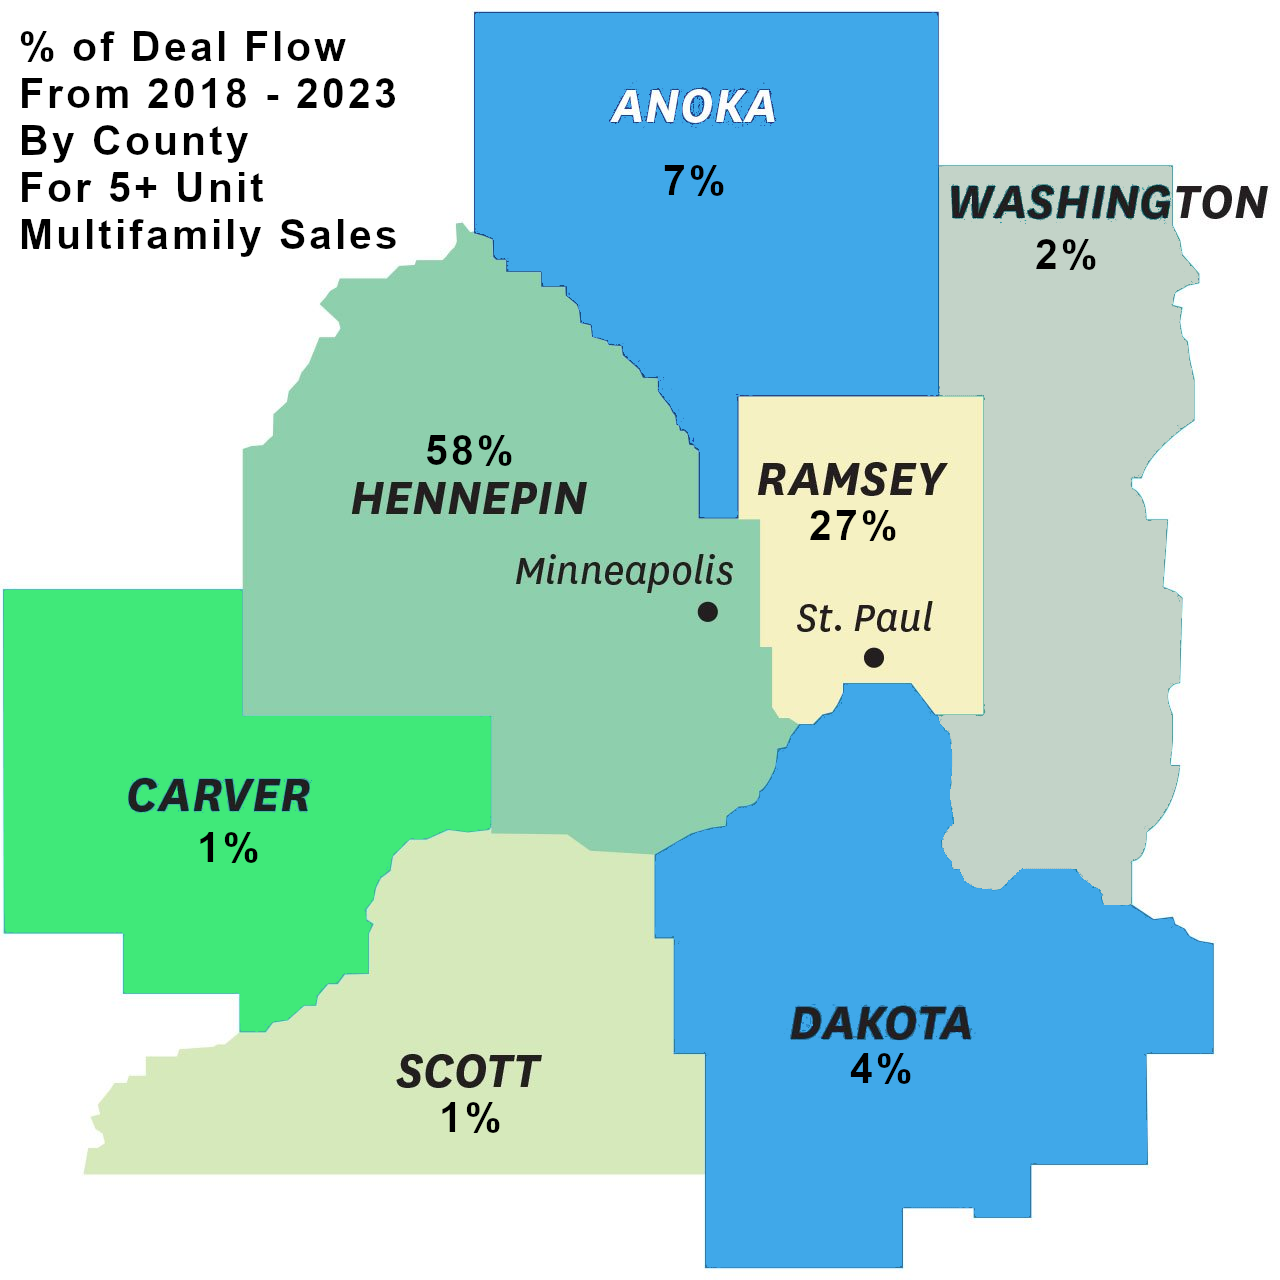
Check out this visual of the deal flow for 5+ unit multifamily sales in the 7 county metro area that makes up the Twin Cities.

As you can see, the majority of transactions (58%) over the past 6 years have taken place in Hennepin County. Ramsey County follows in 2nd place with 27%. The rest of the metro trails far behind with transaction volume ranging between 1 - 7%.
What does this mean for the savvy investor. Well, it's a starting place for creating an acquisition strategy.
For example - if you've decided that you really like Dakota County then you should be aware that, on average there are only 13 sales per year. Not all of those transactions are publicly marketed and not all of the properties will fit your other buying criteria in terms of property size, unit count, age, condition, class or price-range.
It's a good idea to get in touch with every commercial broker that transacts in this area and be sure to get on their distribution list.
You'll want to seriously underwrite each deal that comes your way and recognize that you only have a limited number of opportunities to make a purchase.
 If you have a 5+ unit property in Hennepin County and you are considering selling this year, then it's important to understand that you have more competition. Certainly there are many attractive locations in Hennepin County and buyers are still very interested in investing there.
In order to maximize your property value, take a look at it from a buyer's perspective. Are you attracting high-quality residents who pay on time, respect their neighbors and take care of their rental units? Are you keeping rents up with the market so that you are optimizing your top-line revenue? Are you balancing keeping expenses low while not accumulating a list of deferred maintenance items.
It takes a eye for detail to operate these properties proficiently! If you'd like a second opinion on your business operations then reach out for a free consultation.
| Year | Anoka | Carver | Dakota | Hennepin | Ramsey | Scott | Washington | Total 7 County Metro |
| 2018 | 25 | 4 | 15 | 208 | 81 | 1 | 3 | 337 |
| 2019 | 22 | 1 | 14 | 201 | 63 | 4 | 10 | 315 |
| 2020 | 16 | 3 | 10 | 144 | 58 | 6 | 2 | 239 |
| 2021 | 23 | 3 | 16 | 179 | 107 | 6 | 9 | 343 |
| 2022 | 29 | 0 | 14 | 145 | 94 | 2 | 4 | 288 |
| 2023 | 12 | 2 | 7 | 128 | 60 | 1 | 3 | 213 |
| Total Last 6 | 127 | 13 | 76 | 1005 | 463 | 20 | 31 | 1735 |
| Average Per Year | 21 | 2 | 13 | 168 | 77 | 3 | 5 | 289 |
| % of Total | 7% | 1% | 4% | 58% | 27% | 1% | 2% |
|
Source data is from Costar as of 02/27/2024. I've compiled this information into the chart and graph displayed above. If you are looking for more specific market information then contact me with your request.


